


...
Research Planning

...
Tool Development

...
Research Methodology

...
Data Collection

...
Interpretation

...
Data Analysis

...
Data Solutions

...
Chronology

...
Sample Calculation

...
Visualization
-
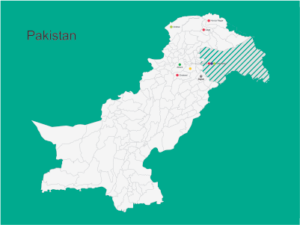
- Pakistan Projects
-

- Upwork Projects

-

- Fiverr Projects

-
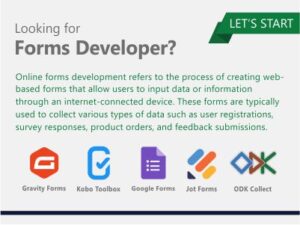
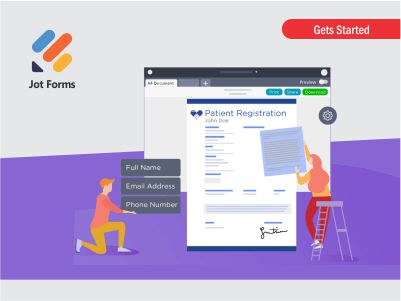
- Survey Forms Development


-

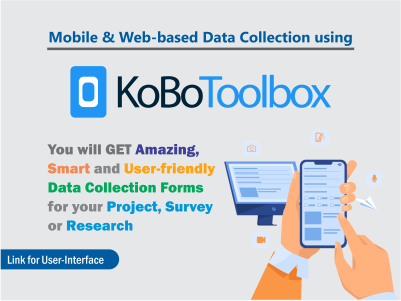
- Kobo Toolbox Forms
-
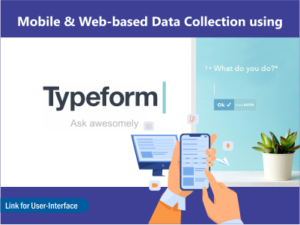
- Typeform Development
-

- Data Analysis

-

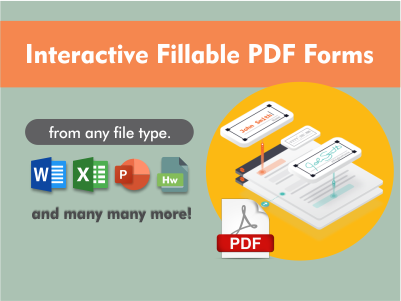
- PDF Processing
-
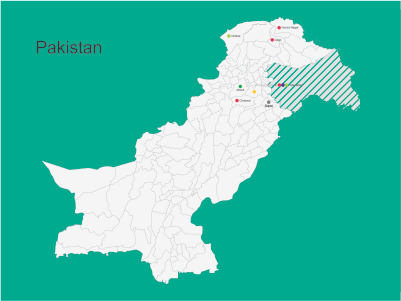
- Pakistan Projects
-
- Upwork Projects
-
- Fiverr Projects
-
- Survey Forms Development
-
- Kobo Toolbox Forms
-
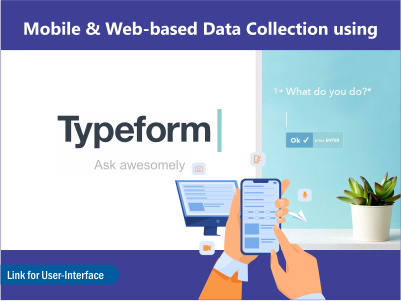
- Typeform Development
-
- Data Analysis
-
- PDF Processing